Wireline Scanning
Televiewer Scanning
Televiewer Scanning directly maps the wall of the drillhole or well casing. The outputs are 3D images of a drillhole and can replace orientated core, as the televiewer directly maps the location and orientation of defects, fractures and bedding planes which are all oriented to true north. When compared alongside the core, televiewer is extremely useful for differentiating drilling induced fractures with geologic defects. You don’t go back to core logging once you have used Televiewers; it is that good. Outputs are is repeatable and digital, and the data can be fed into many modelling packages.
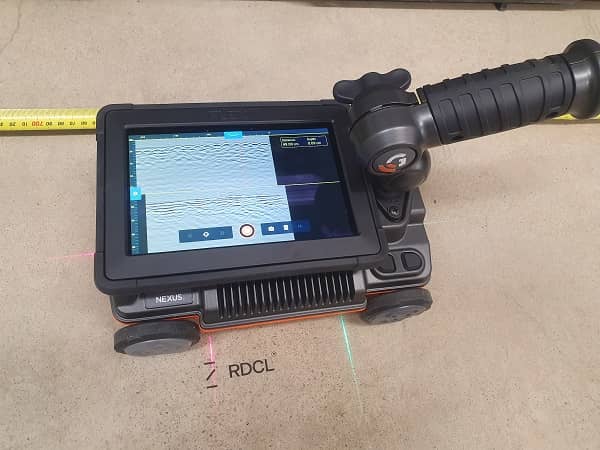
RDCL typically runs three separate tools:
- Mechanical Calliper; produces a 3D diameter of a drillhole, above and below water line, using three spring loaded arms which measure hole diameter
- Acoustic Televiewer; produces a 3D acoustic image of the drillhole wall, below the water line
- Optical Televiewer; produces a 3D optical image (photo image) of the drillhole wall, above and below the water line.
Acoustic Televiewer transmits and receives high frequency soundwaves to image the drill hole wall. The strength of the acoustic reflection depends on the strength of the soil/rock. Defects on the soil/rock produce weaker reflections. Acoustic Televiewer only works in fluid filled holes, as these acoustic waves cannot propagate through air.
Optical Televiewer contains a 360-degree camera and LED light that captures many thousand still images compiled to image the hole wall. The Optical televiewer works in both dry and water filled holes. Clear water or dry holes produce the best results for optical data as murky water produces poor photo quality.
Compensated Density Logging
Compensated density logging uses a radioactive source (Ce-137) to measure the bulk density of the soil/rock from inside the drillhole. Gamma radiation excites the electrons in the drillhole wall causing them to scatter and subsequently, be measured by the tool. The electron density measured by the tool is related and used to inform the bulk density of the formation. This creates a quantitative density measurement the entire length of the scanned drill hole providing much bigger datasets than laboratory testing of isolated core samples.
Density logging provides an accurate and high-resolution log of density values of the drillhole. When assumed densities are not sufficient for engineering design, this tool provides valuable information especially when coupled with in-situ seismic methods (i.e. FWS or PS Logger) to derive the elastic moduli for engineering. Outputs aid in lithology mapping, weathering assessments, rock strength and moduli (coupled with seismic). It is also very useful for grout assessments in certain drill holes.
PS Suspension Logging
PS suspension logging measures the in-situ P-wave and S-wave velocities of the geologic units from a borehole. The tool contains a source and dual receiver system that generates its own seismic waves and measures the compressional and shear waveforms and arrival times for both near and far distances. The tool requires fluid filled open-holes to survey, and can collect in-situ downhole seismic data in marine environments, where sCPT and DH Seismic are problematic.
A PS logger can collect seismic data far deeper than conventional Downhole Seismic Surveys, where the source is at the surface. A Downhole seismic survey may reach as far as 50-80m but generally not beyond. The PS Logger is only limited by the length of the wireline winch, and RDCL has capacity for 1400m!
Full Wave Sonic Logging
Full Wave Sonic Logging measures in-situ P-wave velocities, and calculated (through semblance analysis) S-wave velocities of geologic units from a borehole. FWSS is most commonly used in combination with other logs to provide permeability, porosity and other elastic properties of the rock.
The FWS requires competent rock to produce S-wave datasets, due to the way the waves are produced and logged. This tool is not designed for soils and soft rock.
The tool has a source – multi receiver system. The source emits high frequency acoustic sources that are picked up by the various receivers and sample the full waveform. Logging is continuous throughout the drill hole, assuming fluid filled holes.